Mermaid
Mermaid is a diagramming and charting tool that can be defined inside Markdown code blocks.
Component syntax
With a similar syntax to code blocks, creating a Mermaid diagram requires a ``` code fence with the inclusion of the mermaid specifier.
```mermaid
graph LR
    A[Hard edge] -->|Link text| B(Round edge)
    B --> C{Decision}
    C -->|One| D[Result one]
    C -->|Two| E[Result two]
```
graph LR
A[Hard edge] -->|Link text| B(Round edge)
B --> C{Decision}
C -->|One| D[Result one]
C -->|Two| E[Result two]Directives
Mermaid directives can be configured using the recommended %%{init: { }}%% syntax as the first line just inside the ```mermaid block.
From the Mermaid docs:
Directives gives a diagram author the capability to alter the appearance of a diagram before rendering by changing the applied configuration.
All Mermaid directives are supported by Retype.
The following sample demonstrates applying a theme to the diagram:
```mermaid
%%{init: { 'theme': 'forest' }}%%
graph LR
    A[Hard edge] -->|Link text| B(Round edge)
    B --> C{Decision}
    C -->|One| D[Result one]
    C -->|Two| E[Result two]
```%%{init: { 'logLevel': 'debug', 'theme': 'forest' }}%%
graph LR
A[Hard edge] -->|Link text| B(Round edge)
B --> C{Decision}
C -->|One| D[Result one]
C -->|Two| E[Result two]Syntax highlighting block
In order to draw a mermaid code block with syntax highlighting instead of rendering the contents, please use the mermaid-js block syntax specifier.
```mermaid-js
%%{init: { 'theme': 'forest' }}%%
graph LR
    A[Hard edge] -->|Link text| B(Round edge)
    B --> C{Decision}
    C -->|One| D[Result one]
    C -->|Two| E[Result two]
```
%%{init: { 'logLevel': 'debug', 'theme': 'forest' }}%%
graph LR
A[Hard edge] -->|Link text| B(Round edge)
B --> C{Decision}
C -->|One| D[Result one]
C -->|Two| E[Result two]Diagram types
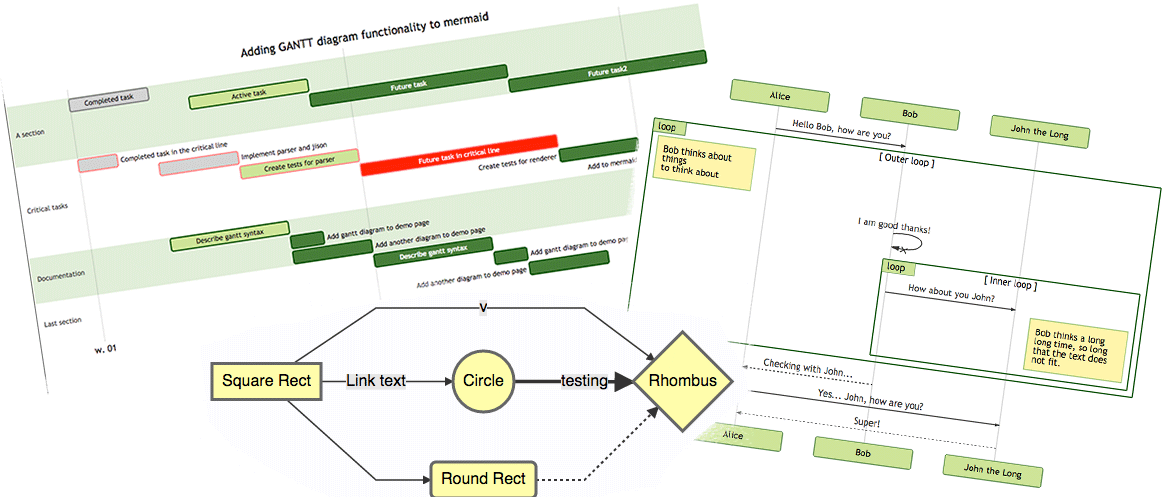
Flowchart
More details in the Mermaid docs.
```mermaid
graph LR
    A[Square Rect] -- Link text --> B((Circle))
    A --> C(Round Rect)
    B --> D{Rhombus}
    C --> D
```
graph LR
A[Square Rect] -- Link text --> B((Circle))
A --> C(Round Rect)
B --> D{Rhombus}
C --> DSequence diagram
More details in the Mermaid docs.
```mermaid
sequenceDiagram
    participant Alice
    participant Bob
    Alice->>John: Hello John, how are you?
    loop Healthcheck
        John->>John: Fight against hypochondria
    end
    Note right of John: Rational thoughts <br/>prevail!
    John-->>Alice: Great!
    John->>Bob: How about you?
    Bob-->>John: Jolly good!
```
sequenceDiagram
participant Alice
participant Bob
Alice->>John: Hello John, how are you?
loop Healthcheck
John->>John: Fight against hypochondria
end
Note right of John: Rational thoughts <br/>prevail!
John-->>Alice: Great!
John->>Bob: How about you?
Bob-->>John: Jolly good!Gantt diagram
More details in the Mermaid docs.
```mermaid
gantt
    title A Gantt Diagram
    dateFormat  YYYY-MM-DD
    section Section
    A task           :a1, 2014-01-01, 30d
    Another task     :after a1  , 20d
    section Another
    Task in sec      :2014-01-12  , 12d
    another task      : 24d
```
gantt
title A Gantt Diagram
dateFormat YYYY-MM-DD
section Section
A task :a1, 2014-01-01, 30d
Another task :after a1 , 20d
section Another
Task in sec :2014-01-12 , 12d
another task : 24dClass diagram
More details in the Mermaid docs.
```mermaid
classDiagram
Class01 <|-- AveryLongClass : Cool
Class03 *-- Class04
Class05 o-- Class06
Class07 .. Class08
Class09 --> C2 : Where am i?
Class09 --* C3
Class09 --|> Class07
Class07 : equals()
Class07 : Object[] elementData
Class01 : size()
Class01 : int chimp
Class01 : int gorilla
Class08 <--> C2: Cool label
```
classDiagram Class01 <|-- AveryLongClass : Cool Class03 *-- Class04 Class05 o-- Class06 Class07 .. Class08 Class09 --> C2 : Where am i? Class09 --* C3 Class09 --|> Class07 Class07 : equals() Class07 : Object[] elementData Class01 : size() Class01 : int chimp Class01 : int gorilla Class08 <--> C2: Cool label
Entity Relationship
More details in the Mermaid docs.
```mermaid
erDiagram
    CUSTOMER ||--o{ ORDER : places
    ORDER ||--|{ LINE-ITEM : contains
    CUSTOMER }|..|{ DELIVERY-ADDRESS : uses
```
erDiagram
CUSTOMER ||--o{ ORDER : places
ORDER ||--|{ LINE-ITEM : contains
CUSTOMER }|..|{ DELIVERY-ADDRESS : usesUser Journey
More details in the Mermaid docs.
```mermaid
journey
    title My working day
    section Go to work
      Make tea: 5: Me
      Go upstairs: 3: Me
      Do work: 1: Me, Cat
    section Go home
      Go downstairs: 5: Me
      Sit down: 5: Me
```
journey
title My working day
section Go to work
Make tea: 5: Me
Go upstairs: 3: Me
Do work: 1: Me, Cat
section Go home
Go downstairs: 5: Me
Sit down: 5: MeKanban diagram
More details in the Mermaid docs.
kanban
  Todo
    [Create Documentation]
    docs[Create Blog about the new diagram]
  [In progress]
    id6[Create renderer so that it works in all cases. We also add som extra text here for testing purposes. And some more just for the extra flare.]
  id9[Ready for deploy]
    id8[Design grammar]@{ assigned: 'knsv' }
  id10[Ready for test]
    id4[Create parsing tests]@{ ticket: MC-2038, assigned: 'K.Sveidqvist', priority: 'High' }
    id66[last item]@{ priority: 'Very Low', assigned: 'knsv' }
  id11[Done]
    id5[define getData]
    id2[Title of diagram is more than 100 chars when user duplicates diagram with 100 char]@{ ticket: MC-2036, priority: 'Very High'}
    id3[Update DB function]@{ ticket: MC-2037, assigned: knsv, priority: 'High' }

  id12[Can't reproduce]
    id3[Weird flickering in Firefox]
kanban
Todo
[Create Documentation]
docs[Create Blog about the new diagram]
[In progress]
id6[Create renderer so that it works in all cases. We also add som extra text here for testing purposes. And some more just for the extra flare.]
id9[Ready for deploy]
id8[Design grammar]@{ assigned: 'knsv' }
id10[Ready for test]
id4[Create parsing tests]@{ ticket: MC-2038, assigned: 'K.Sveidqvist', priority: 'High' }
id66[last item]@{ priority: 'Very Low', assigned: 'knsv' }
id11[Done]
id5[define getData]
id2[Title of diagram is more than 100 chars when user duplicates diagram with 100 char]@{ ticket: MC-2036, priority: 'Very High'}
id3[Update DB function]@{ ticket: MC-2037, assigned: knsv, priority: 'High' }
id12[Can't reproduce]
id3[Weird flickering in Firefox]Sankey diagram
More details in the Mermaid docs.
```mermaid
sankey-beta

%% source,target,value
Electricity grid,Over generation / exports,104.453
Electricity grid,Heating and cooling - homes,113.726
Electricity grid,H2 conversion,27.14
```
sankey-beta %% source,target,value Electricity grid,Over generation / exports,104.453 Electricity grid,Heating and cooling - homes,113.726 Electricity grid,H2 conversion,27.14
Architecture diagram
More details in the Mermaid docs.
architecture-beta
    group api(cloud)[API]

    service db(database)[Database] in api
    service disk1(disk)[Storage] in api
    service disk2(disk)[Storage] in api
    service server(server)[Server] in api

    db:L -- R:server
    disk1:T -- B:server
    disk2:T -- B:db
architecture-beta
group api(cloud)[API]
service db(database)[Database] in api
service disk1(disk)[Storage] in api
service disk2(disk)[Storage] in api
service server(server)[Server] in api
db:L -- R:server
disk1:T -- B:server
disk2:T -- B:dbXY Chart
More details in the Mermaid docs.
xychart-beta
    title "Sales Revenue"
    x-axis [jan, feb, mar, apr, may, jun, jul, aug, sep, oct, nov, dec]
    y-axis "Revenue (in $)" 4000 --> 11000
    bar [5000, 6000, 7500, 8200, 9500, 10500, 11000, 10200, 9200, 8500, 7000, 6000]
    line [5000, 6000, 7500, 8200, 9500, 10500, 11000, 10200, 9200, 8500, 7000, 6000]
xychart-beta
title "Sales Revenue"
x-axis [jan, feb, mar, apr, may, jun, jul, aug, sep, oct, nov, dec]
y-axis "Revenue (in $)" 4000 --> 11000
bar [5000, 6000, 7500, 8200, 9500, 10500, 11000, 10200, 9200, 8500, 7000, 6000]
line [5000, 6000, 7500, 8200, 9500, 10500, 11000, 10200, 9200, 8500, 7000, 6000]Sequence diagram
More details in the Mermaid docs.
sequenceDiagram
    Alice ->> Bob: Hello Bob, how are you?
    Bob-->>John: How about you John?
    Bob--x Alice: I am good thanks!
    Bob-x John: I am good thanks!
    Note right of John: Bob thinks a long<br/>long time, so long<br/>that the text does<br/>not fit on a row.

    Bob-->Alice: Checking with John...
    Alice->John: Yes... John, how are you?